Sunilios
A powerful Photovoltaic Park monitoring system with full visibility of your system's technical and financial performance, including interactive charts and site layout !
A powerful Photovoltaic Park monitoring system with full visibility of your system's technical and financial performance, including interactive charts and site layout !
Display Parameterizing
Sunilios administrator can:
● Create Substations and define the associated Inverters for immediate Power Production (ie MAIN)
● Create Sections inside each Substation (ie INERTER 2, J04/J03)
● Create Groups for displaying the measurement according to its use (ie Energy Import, Power)
● Declare the Name (ie Cumulate Reactive Energy) , the units(ie KVArh) , a multiplier for adjusting the Machine to Human input (ie 0.001), an offset in case of equipment change(ie 10020)
● Define formulas on Measurement to be used or displayed.
● Define the Name of the Alarms returned by each device according to the Manufacturer
● Set a severity (0-9) upon which a different action (email, SMS) is performed.
● Define email recipient list for Alarm annotation.
Display Sections
● Substations of the Park
● Measurements per Group per Section per Substation
● String Panel Groups Reporting Values Grid for immediate overview of panel malfunction
● List of possible alarms of all the monitored equipment inside the current Section . A color between a nine color pallet is indicating the severity status of each Alarm
● Five Groups of all Park Alarms Overview (Main , Inverter etc) with color indication. Each Group when opened displays
o The last Alarm status with color indication of all the Alarms of the Group
o A History of all the Alarms of the Group
● Export to csv etc of
o All measurements data of a user defined List during a period .
o All produced Alarms during a period
● Park Selection List for immediate Site monitoring change
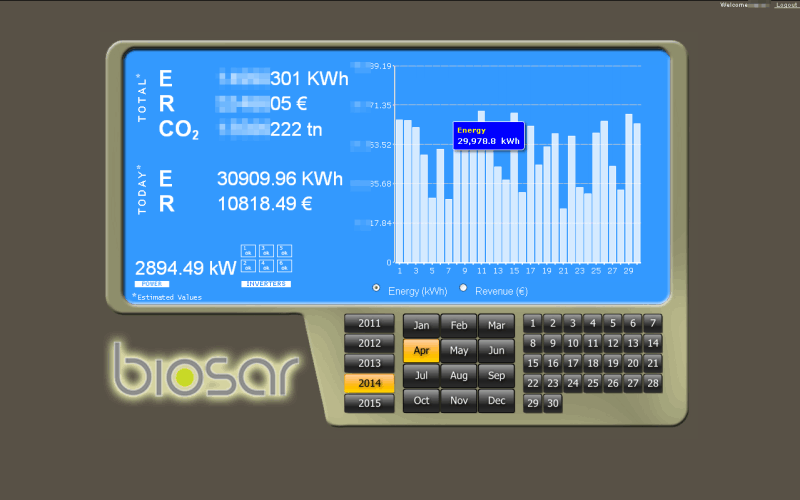
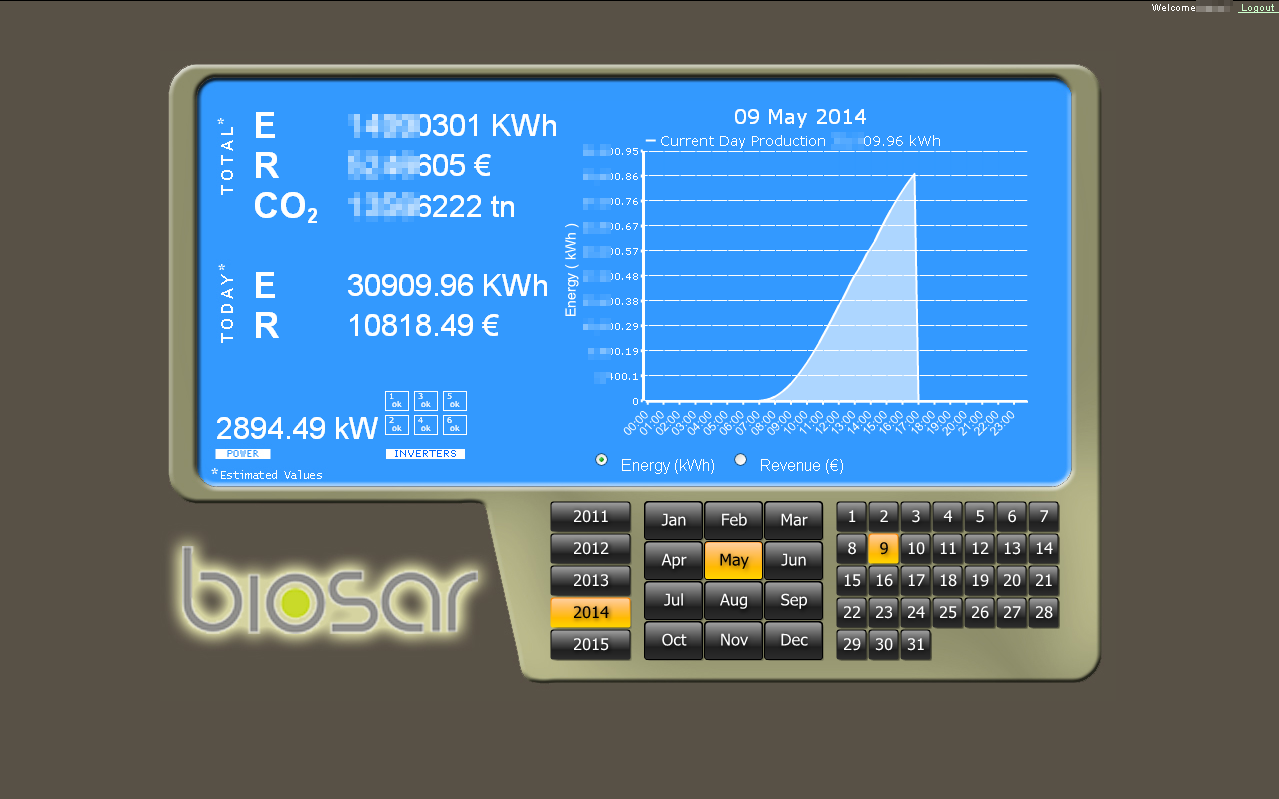
Display for Investors
- Total Park Energy Production, Revenue and Co2 Saving Values
- Current Day Energy And Revenue Production
- Power production
- Inverter Status
35 Ag.Triados str,
15343 Ag. Paraskevi
Attiki Greece
Email: info@webopsis.com
Phone: +30(211)8505100
Fax: +30(211)8505101